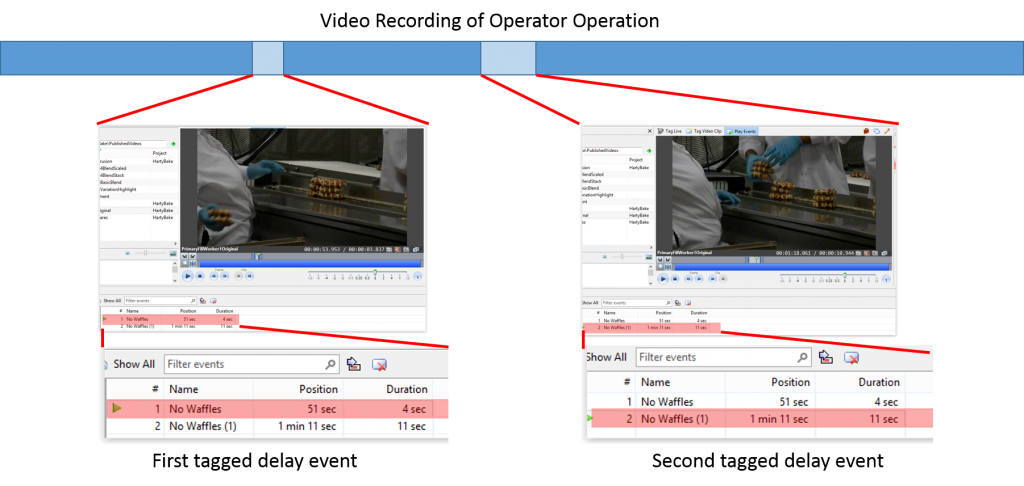
In a previous post, I showed a way to extract detailed operational data from a video clip of human-paced operations. As I did the tagging, I saw some situations where the operator deviated from the normal pattern. They happened when the workers who were passing waffles to the insertion operator fell behind. The operator had to wait. Sometimes, the operator reached to a separate supply of waffles that were stacked out of the video frame to the right. I understand that these were accumulated during an earlier stoppage and this was the way they were merged back into production.
Reaching for the extras changed the work flow, so I decided to tag those episodes separately. One of the cool things about Dartfish is that you don’t have to redo your work to add spontaneous new information. I opened the tagging panel to add a new event. I had modeled the normal waffle insertions as single time events. I defined “waiting for supply” as a variable duration event. The event is started by clicking a button and stopped by clicking it again to toggle it off. I added some other buttons that added descriptive keywords (e.g., “No Waffles”) to further define the actions.
Now, I can rapidly scan through the movie, find the delays and tag them with the new buttons. The information is added and merged to the existing results table. But how do you analyze them? These types of “outlier” events happen rarely or, possibly, occasionally. There aren’t enough (only 2 in the sample clip). Statistical analysis didn’t seem feasible.
Again, Dartfish has an interesting answer.
With Dartfish, it is possible to select all of the tags that have a given keyword and publish just those segments in a much smaller video file … one subclip following the other. In other words, I can select an event keyword and publish a “best hits” movie. When I published a playlist for just the two waiting time events that I tagged, the video runs for only 17 seconds, not the 3+ minutes of the original.

Watch the resulting clip. You can now see what happens during just the occasions when the operator reaches into her private stock. Did you notice that, in both cases, the workers feeding the line were able to replenish the stock before the operator was able to retrieve the waffles from the private stash. In these two cases, the operator should have waited for the suppliers to catch up, rather than trying to reach for the extras.
Two examples is not enough to judge a process and there may be other reasons for working the way that is shown in the video. Nonetheless, the ability to tag infrequent events and then accumulate them in a single, reviewable sequence makes it much easier to analyze actions that only occur occasionally and randomly.
Can you help?
I’m not an employee, investor or reseller for Dartfish, but they are kindly letting me play with it to explore any non-sports uses I can cook up. I am willing to play with videos sent to me by others as long as they don’t hold me to a deliverable timeline and they give me permission to post useful pieces on the blog.

