
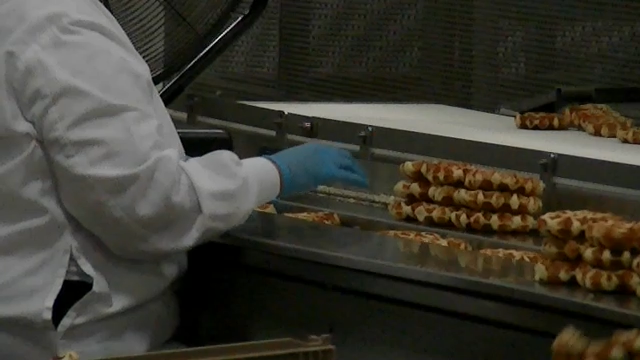
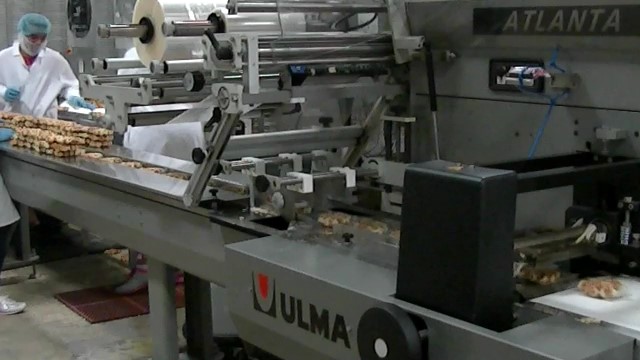
At the end of the Hartybake production process there is an automatic bagger. Waffles are placed on a conveyor with small moving pegs to control spacing. Workers transfer the waffles that exit from the oven and insert them in the conveyor. The naturally irregular shape of these exotic Belgian waffles makes it impractical to link the processes automatically.
In a previous post, I explored how Dartfish can extract the statistical characteristics by which a worker placed the waffles on the line. In reality, however, Hartybake uses two workers to fill the conveyor. Their work is organized as shown in the following diagram and there are still some important unknowns.
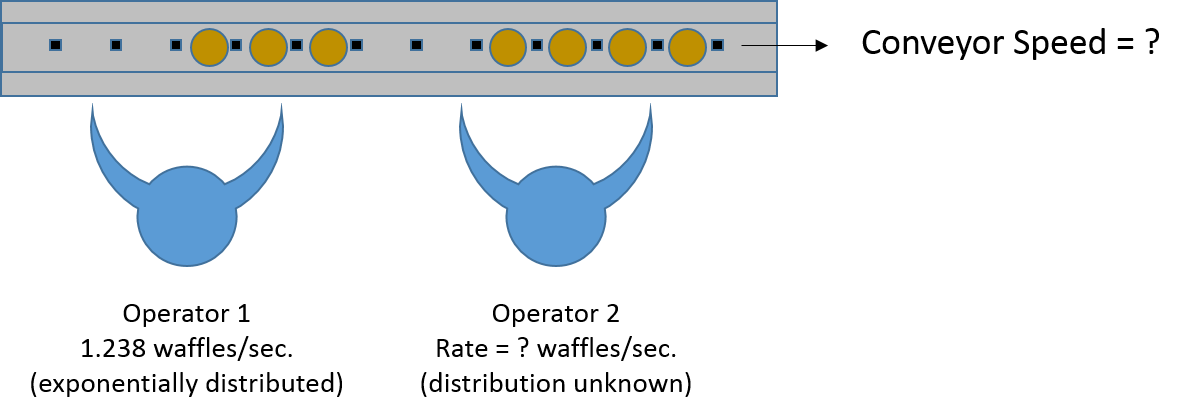
We don’t know the conveyor speed and we have no idea how the work of the secondary fill operator is structured. However, videos of the process can provide the answers. Start with the conveyor speed. If there is any video footage where we can see the conveyor move, we can simply count the number of positions that pass in a give period of time.The following shows a screen capture of an overhead video that watches the waffles entering the heat sealer.
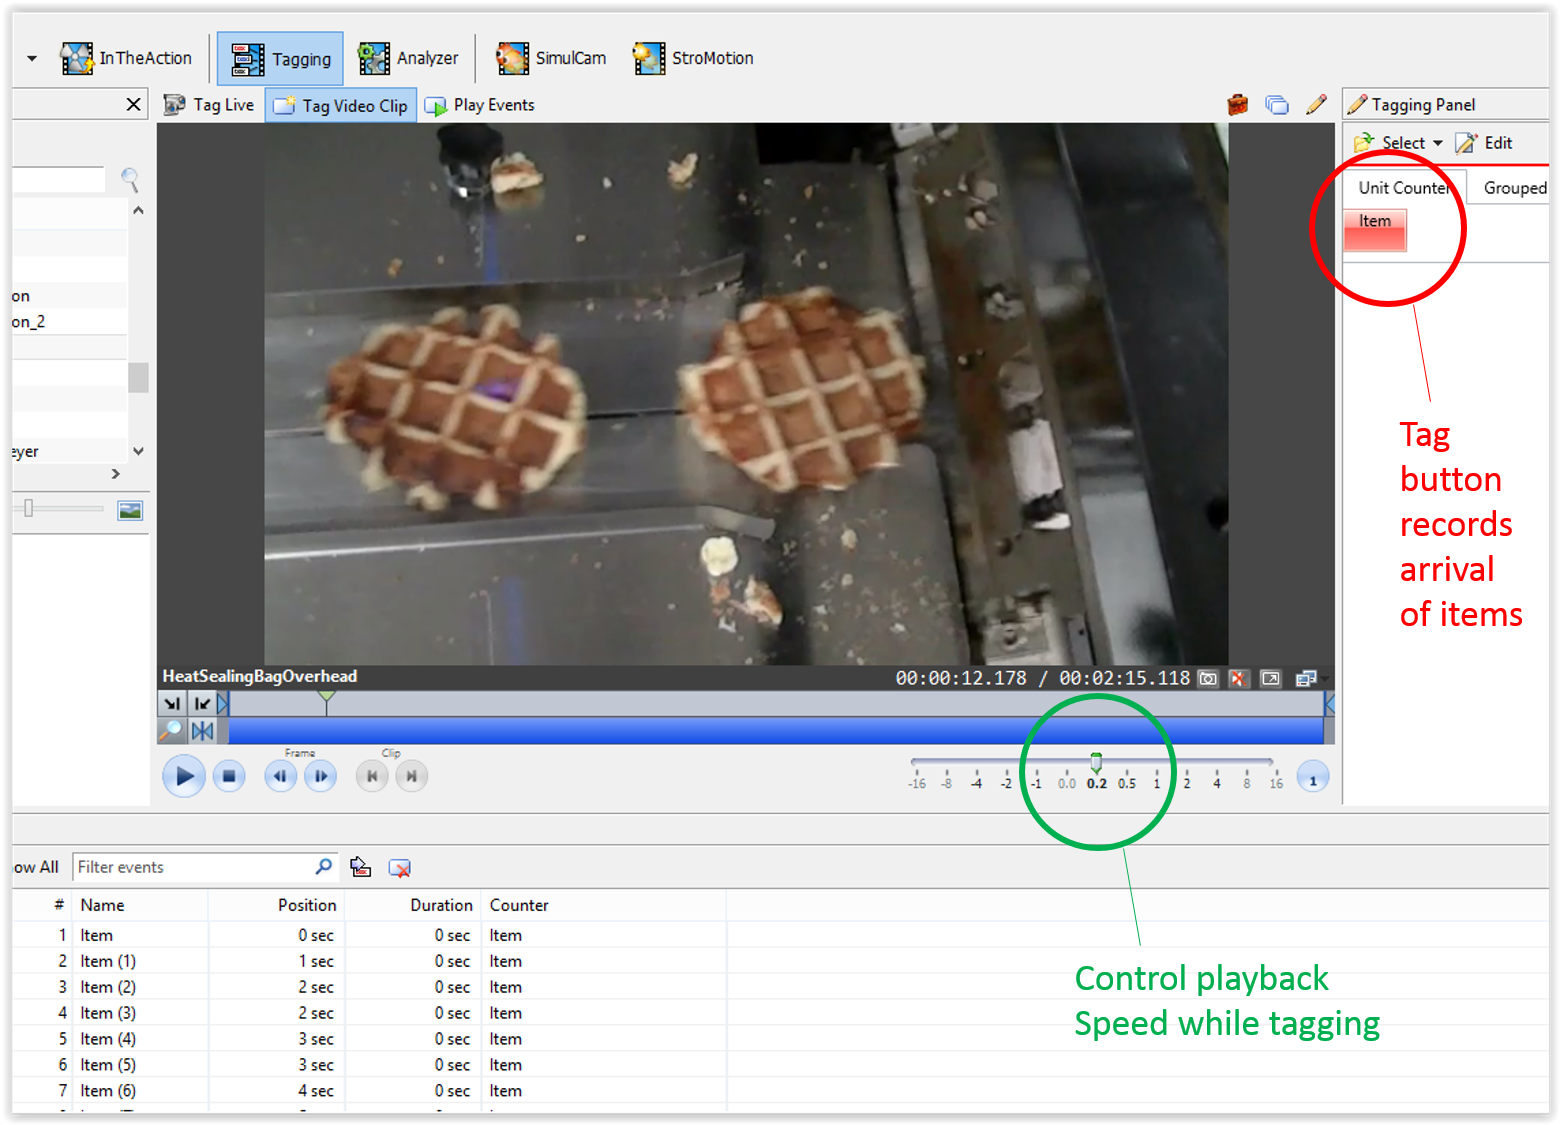
There are many ways to count things in a video. One method, shown here, is to create a tagging button and run the video slowly (in this case 20% of normal frame rate). Just click the button whenever a waffle reaches a defined point on the line. The result will be a list of every waffle and their times. Divide the number of items by the final time and the conveyor rate is about 120 waffles per minute or approximately 2 per second. One of the interesting features of Dartfish is that you can change the video playback rate, but all of the tagged times remain consistent with the original video frame rate … i.e. consistent with the actual operation.
From the work in the previous post, we know that the first operator can fill the conveyor at about 1.2 waffles per second and the times are exponentially distributed. That means that the second fill worker must be working at about 0.8 waffles per second to reach the 2 waffles per second line rate. It would appear that the workload is unequal.
To check, I applied the same tagging process to the second fill worker that I previously applied to the first. The results suggest that the exponential distribution is not as good a fit for this worker as it was for the first. The problem is evident both from the data and from a review of the video clip.
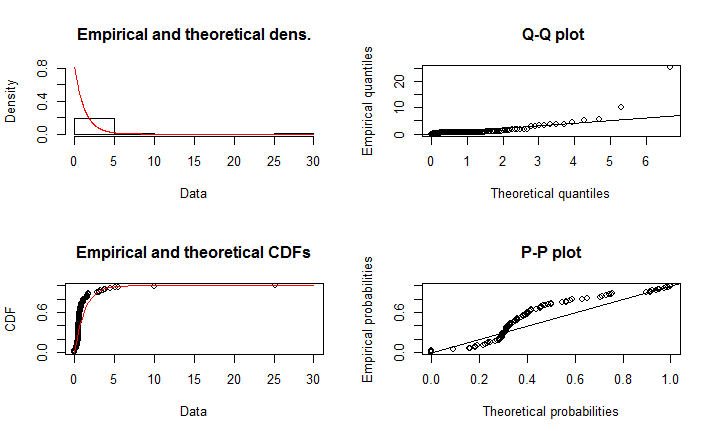
The second fill worker appears to work very quickly … when there is work to be done. However, the job is to fill the gaps left by the first fill operator, so those opportunities come in spurts. There are extended periods when the second fill operator watches and waits for an opportunity.
To get a better idea of the comparative performance, I took the data for each worker and eliminated the unusually long gaps. For the first worker, those were related to times when the waffle supply lagged behind. For the second worker, those were the times when the conveyor was already filled.
| Worker 1 | Worker 2 | |
| Distribution of All Times | 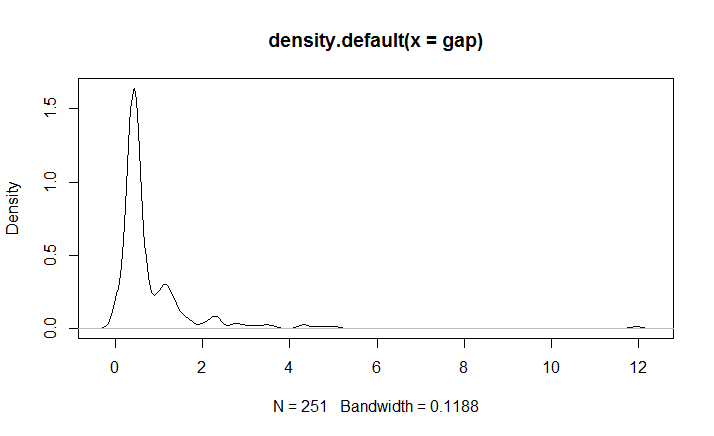 | 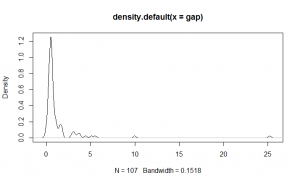 |
| Distribution Excl. Long Gaps | 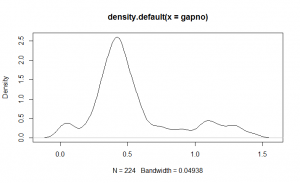 | 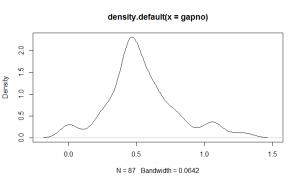 |
| Average Production Rate | 1.24 waffles/sec | 0.8 waffles/sec |
| Peak Production Rate | 1.85 waffles/sec | 1.85 waffles/sec. |
With this data the picture becomes much clearer. The two workers are working at essentially the same peak performance. Since the first worker has a completely empty conveyor to work with, that operator has picked a comfortable speed that just happens to be a bit faster than half the required throughput. The second worker is just as fast, but has fewer openings to fill, so the average production rate is whatever capacity was left over.
The key observation is that ALL of this analysis was obtained solely by observing and analyzing the video clips. There is nothing in this post that was obtained from managers, workers or from any other information source. This underscores how much information is contained in the typical operational video … if you can tease it out.