A growing number of operations and factory designers use sophisticated discrete simulation tools to test their facility layouts and designs. For major design projects, software systems like the following are often required.
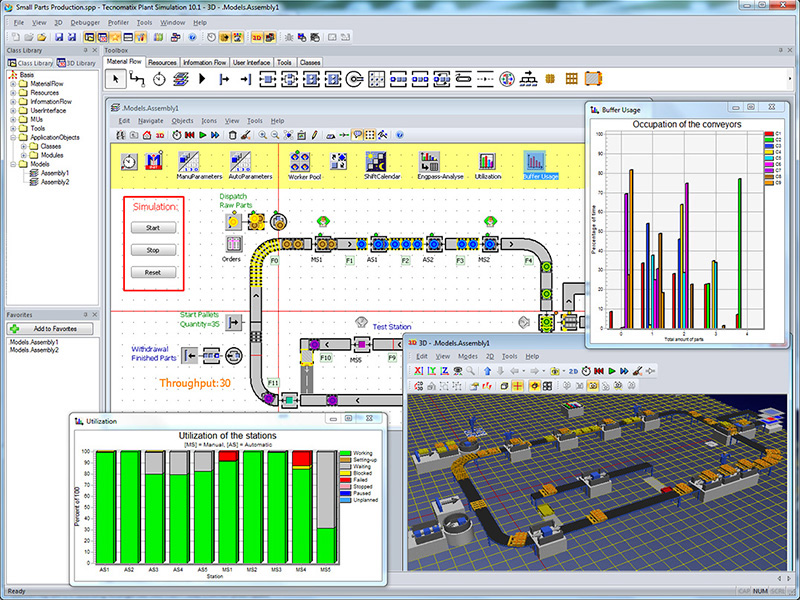
Siemens Plant Simulation Software
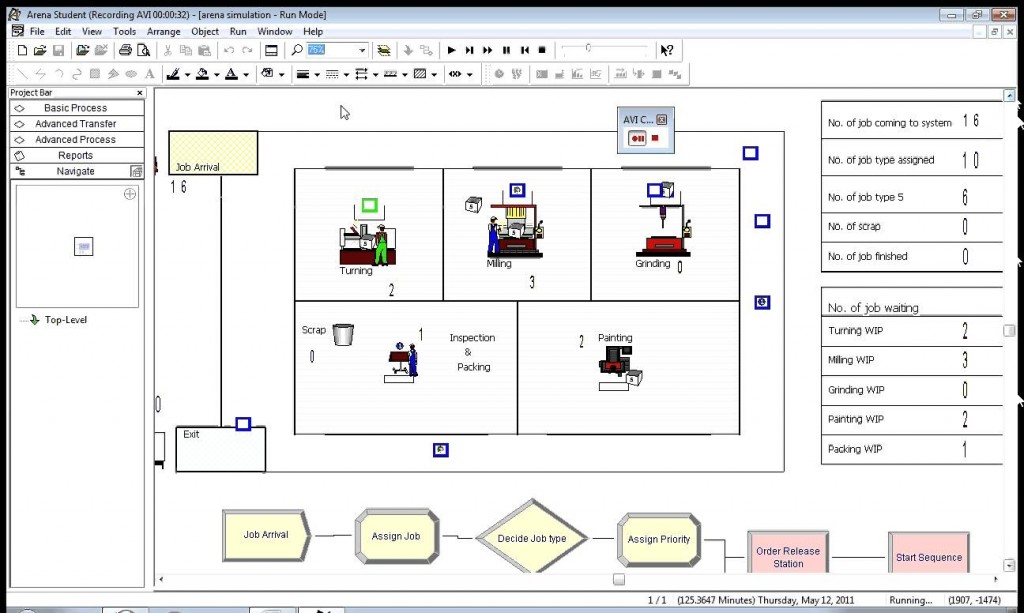
Rockwell Arena Simulation Software
These (and similar software packages) have a common requirement. They need to assume the distribution of process variation at each step of the operational cycle. For machines, this is usually well understood. For operations that involve manual human labor, the real pattern of variation may be poorly understood or unknown. Often, designers make simplified assumptions such as that it is a Poisson process, or that it has a triangular distribution that can be estimated based on worst case, most likely, and best case estimates.
Often, that is OK. Sometimes it is not.
So is there an easy (or at least easier) way to find out how variation is really distributed? Yes, I can use Dartfish and the R statistical software to extract actual human operational data and use it to find the simulator’s statistical distribution that fits it best.
The technique starts by recording a video (longer is better) of a worker who is performing the task in normal production. If the task has not yet been established (i.e. if the simulation is to help plan an operation that doesn’t yet exist), you can look for some manual operation that is likely to be similar. It may not be perfect, but it will be better than a guess. The following video clip from our friends at Hartybake shows a worker inserting waffles into the line that feeds the automatic bagger.
There are a lot of visible behaviors, even in this short snippet. When the operator has 3 waffles in her hand, she can drop them very quickly. She often grabs with both hands and alternates the placement. However, there are gaps in her actions … when she is reaching for another stack and even longer ones for other reasons that are visible in the longer original video clip.
So is there a usable pattern here? One that we can exploit in a process simulator? The answer is yes … but only if we extract better defined, more quantitative data. The technique that I used is to take the video into the Dartfish Tagging View and develop a simple tagging panel.
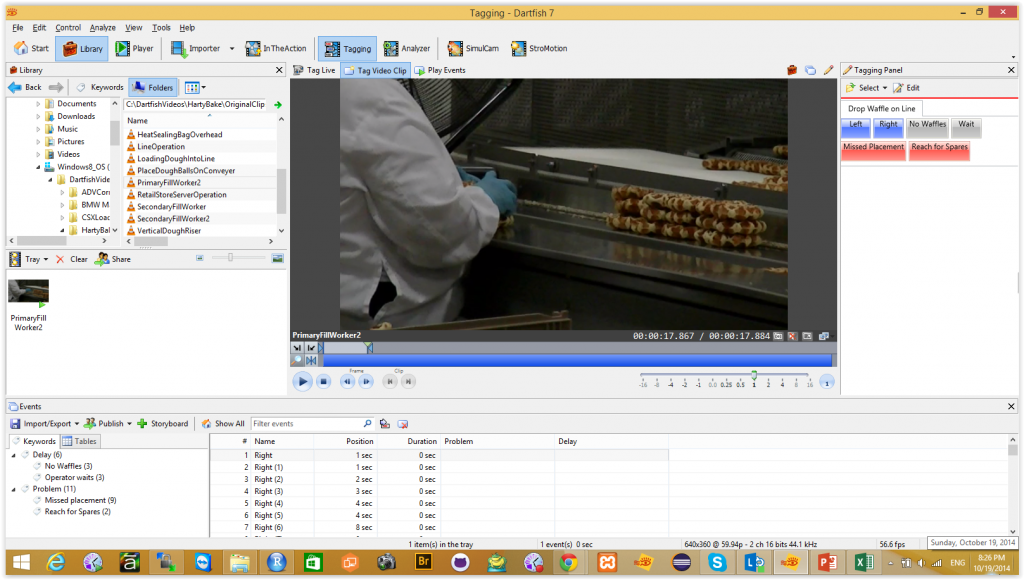
The key tool is the tagging panel that lets me click a button whenever the operator drops a waffle. I made it slightly fancier by using two buttons … one for the left hand and one for the right hand. Then I advanced the video and clicked a button every time a waffle was dropped in the line. In a 3.5 minute video clip, that happened 252 times.
Dartfish is quite exact in its timing. It can track video at 60 frames per second. That means that, with a bit of care, I can assign waffle placements within a 60th of a second … from standard HD video. The result is a table of insertion times that I can export as a CSV file.
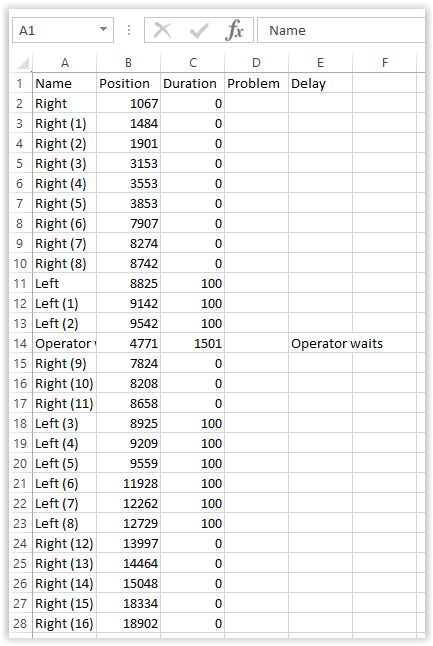
Now that I have a CSV with the exact time of every waffle drop, I can investigate the possible variation patterns that might be relevant. To do that, I wrote a short R program to import the data and explore possible fits with common probability distributions.
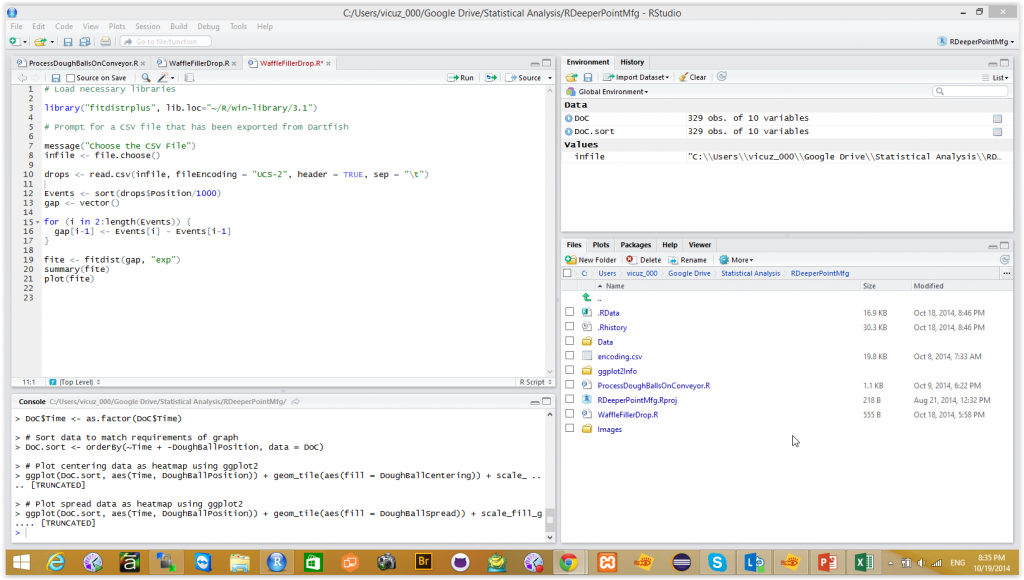
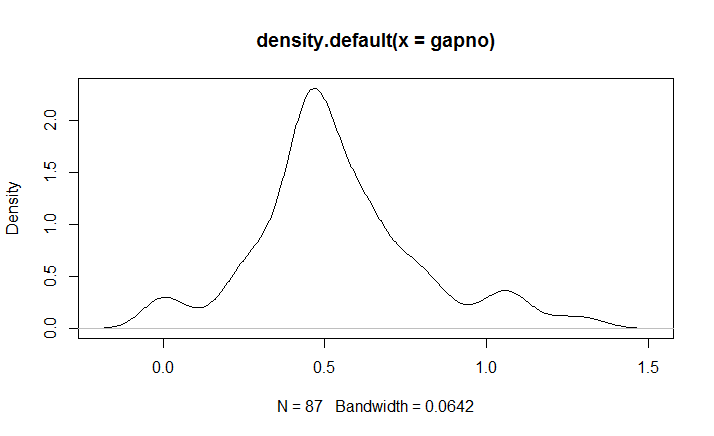
For my first attempt, I chose to test the pattern of waffle drops against the most likely candidate .. the exponential distribution. There is a long operations management history that says that events like these often follow a pattern where the times between successive events is consistent with the predictions of the Exponential distribution. So I tried that to start. The results I got were as follows:

Results on other printouts indicate that the average insertion rate is 1.238 per second.
I could play with some of the other distributions, but the observed data fits the Exponential distribution pretty well … and there are some great conveniences to working with processes that fit that model. So it looks like I have an answer that is good enough to use – at least as a starting point. All from a few minutes of HD video … stuff I could have recorded with my smartphone.

