
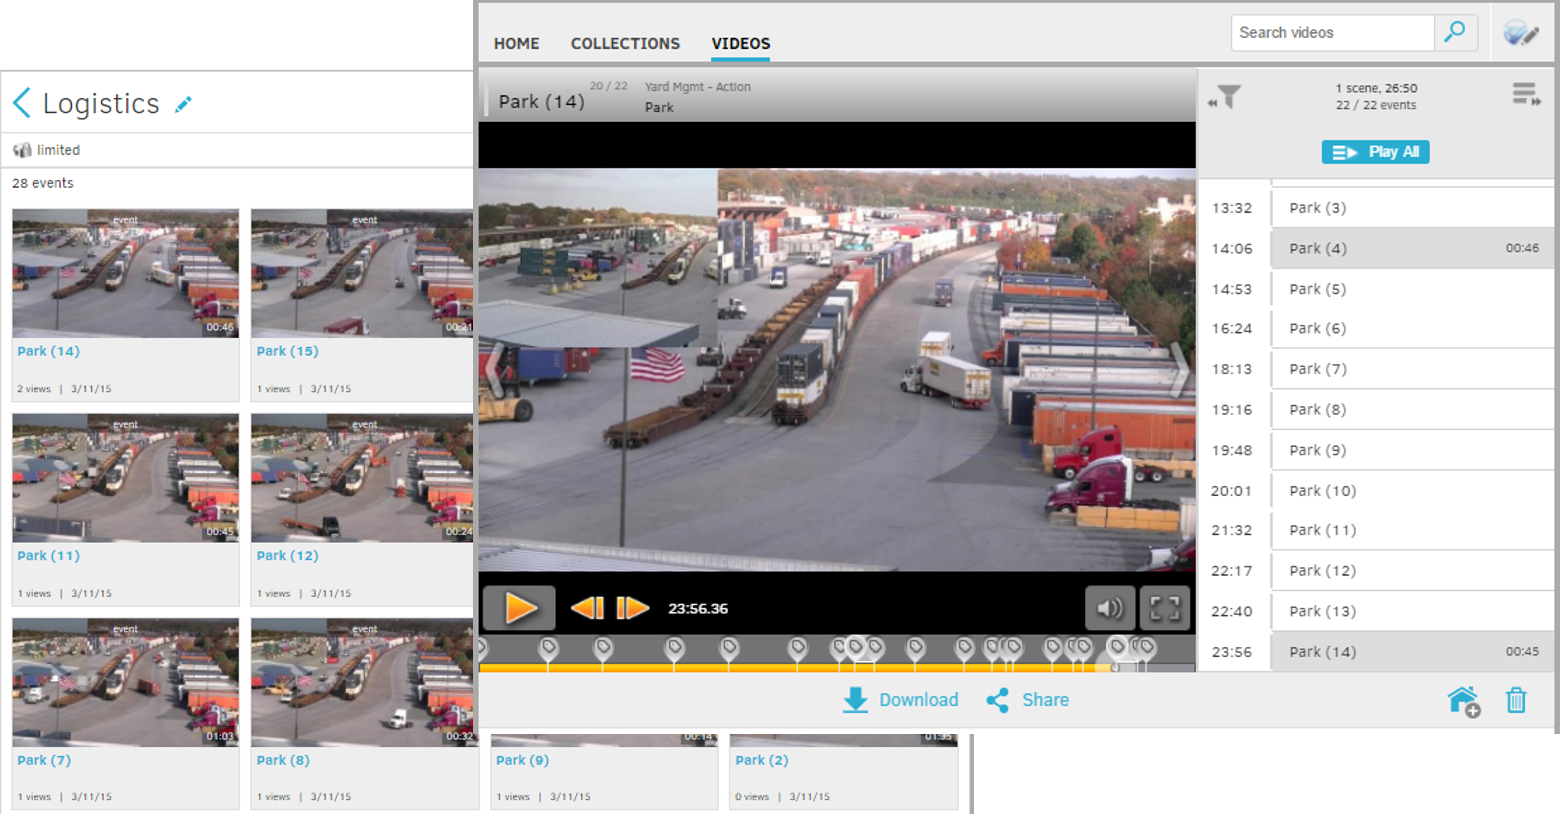
In this post, I took a video of a process (an intermodal train yard) with complex behaviors and used continuous duration tags to select individual elements, follow them on sub-clips and reassemble an extended video so we could see each element’s activity … in isolation.
The yard in question is the CSX Hulsey Intermodal Terminal in downtown Atlanta. I chose this yard because my home overlooks it. I live in a loft with a strategically placed roof deck. I asked permission 2 years ago when I wanted to video operations for my class at Auburn University. After going around their executives for a while, their lawyers concluded that they couldn’t object to video taken from my home.
To understand what is happening, we can look at a map of the Hulsey Yard. It is in a dense urban area and is essentially a long ribbon of yard space that runs along five or six yard tracks. The following diagram shows how trucks drop of and pick up containers from the yard.
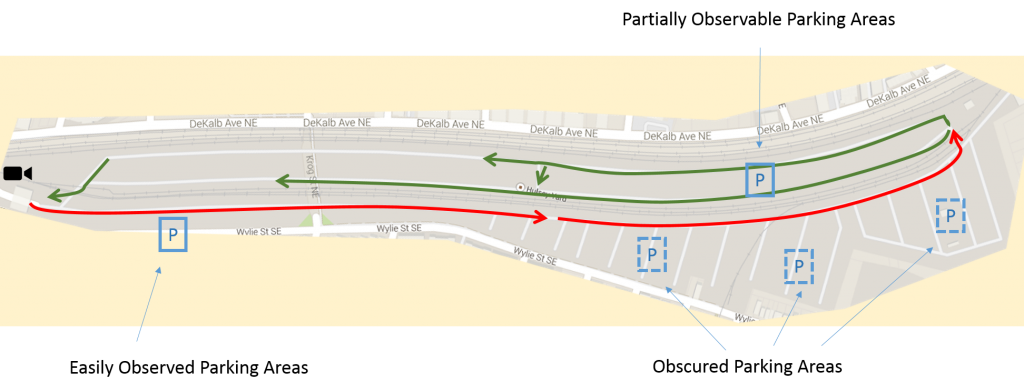
The video is taken the position of the camera icon at left, down the length of the yard towards the right. When trucks drop off or pick up containers, they enter through the gate that is the little white rectangle just below the camera icon. Trucks drive along the bottom road to the end, swing back around and return via one of the two upper routes. Eventually, they will exit through the gate that is beside the entry gate. Each truck will be assigned a location to park or pick up a container. They will follow the standard circuit, but stop at the designated location, do their business, then proceed to complete the circuit and exit.
If you watch a bit of the video and concentrate just on the line haul trucks that enter at the bottom of the frame, it is clear that there is a lot going on. There are trains, container lifts, other trucks and a bunch of “hostelers” or “yard goats. These are CSX’s specialized trucks that can quickly hook up to a trailer to position it for loading or unloading. All of this affects the journey that the customer trucks have to take.
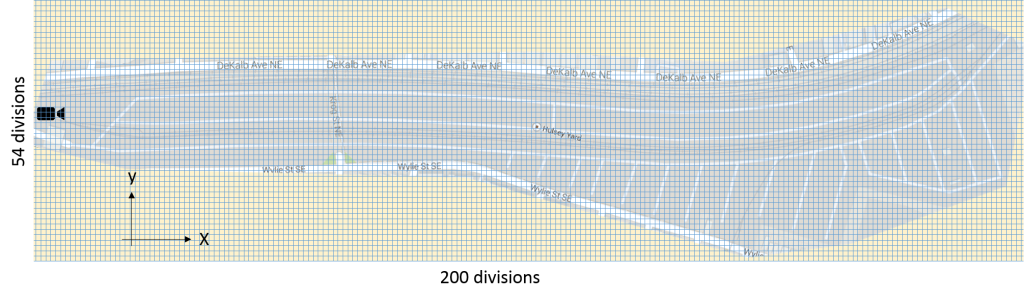
To analyze this more finely, I used a neat Dartfish tagging tool that can capture positions on a diagram or map. It was originally designed to capture information about players on a football field or soccer pitch. I decided to use it to capture information about the sequence of positions and times for trucks in the yard.
To use the Dartfish Zone Tool, I needed an image of the “playing field”. I used the yard layout map and defined a location grid with 200 divisions horizontally and 54 vertically. That divides the layout map into a bunch of small squares that I can click with the mouse.
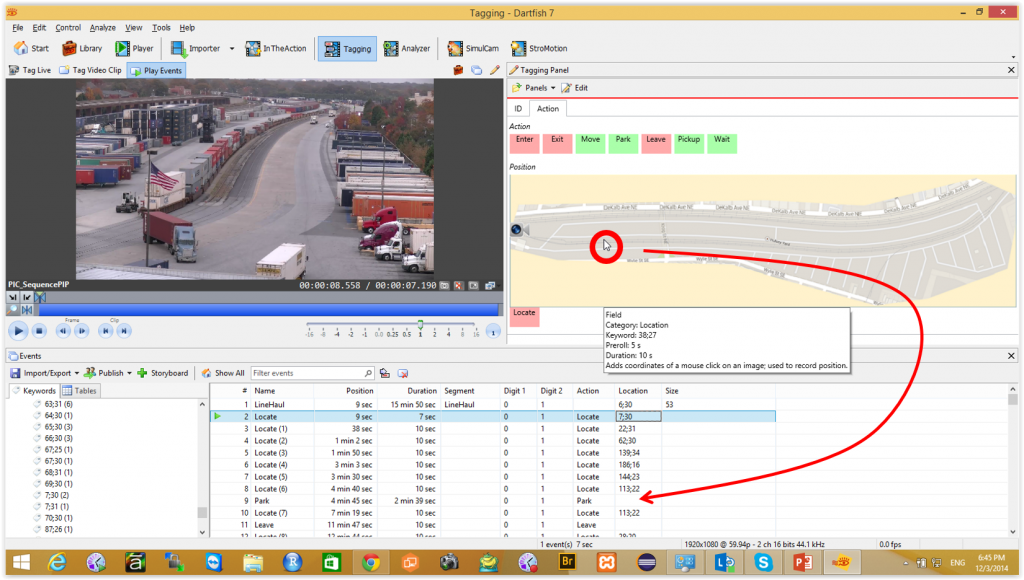
Once the yard is structured for detailed capture, the Dartfish tagging panel makes it easy to capture location information while I am tagging other events that I see. Click on a point on the map and the coordinates from the grid are stored in the tagged event. Any event or action can be associated with a specific location …. With one mouse click!
The first thought is to take the x and y coordinates and plot them for each truck that entered the yard. In this case, the process is harder than I expected, not because of software limitations, but due to the limited camera angle. I can watch a truck enter and drive along the lower road into the distance, but I can’t see what happens in the farther parking areas or be sure what happens after it goes around the turn at the far end. In a few cases, I was able to recognize the tractor and trailer when they reappeared coming back toward me, but in many other cases, I just wasn’t sure. There seemed to be a lot of white tractors pulling 20 ft Maersk containers. I could see one disappear from view at the end of the yard, but was it the same as the one that reappeared a minute or so later? No clue.
The limited sight line cut down on the data that I could tag for each truck, but that probably wouldn’t be an issue for a real-world application. If CSX had commissioned this analysis, I am sure that their surveillance cameras would have supplied enough footage and camera angles to track and position each vehicle quite accurately. In fact, it would be relatively easy to track movements and locations in any setting that was well-covered by decent surveillance cameras. The technique should be applicable for:
- Vehicles in yards and parking lots
- Personnel movements in warehouses
- Customer movements in retail stores
- Passenger movements in transit systems (although the sheer numbers might be unwieldy)
In the next few posts, I will take this data and illustrate some of the ways that it can be used to study operations in the yard.