

In the previous article on this topic, I described how I used the Dartfish Zone tagging tool to record the locations of trucks in an Intermodal yard. By using nearby landmarks, I was able to pick out the vehicle’s approximate position at any point in time and record it as an event that is tied to a specific vehicle.
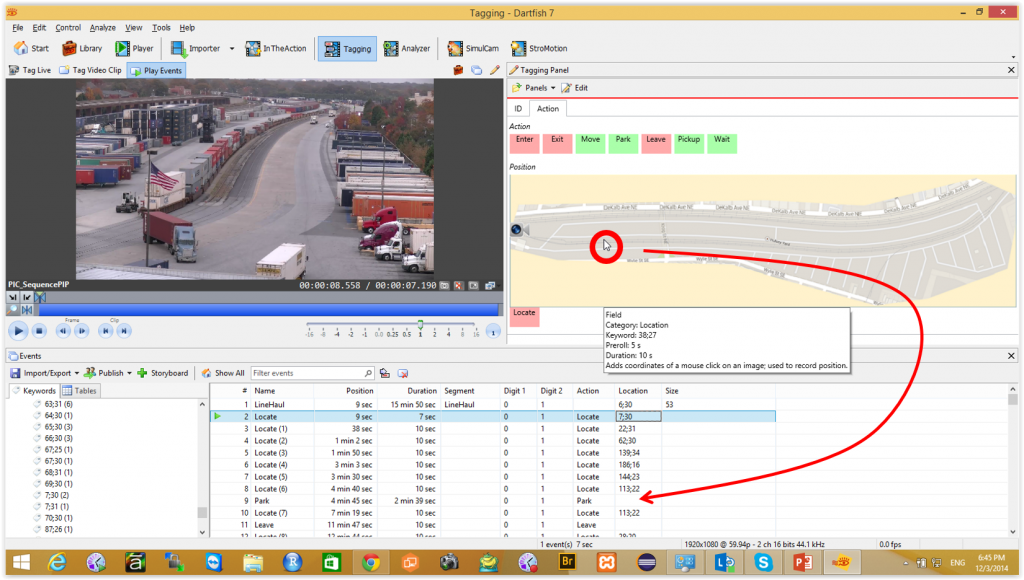
When I export the event database, I have a set of times, vehicle IDs and x, y coordinates that are mapped to a site plan for the yard. My first thought is to plot the progress of the various vehicles using the x, y coordinates. The resulting graph (shown below) is disappointing. It only tells me that all of the trucks come into the yard and drive along the southern roadway until they either park out of sight at the far end, or make the turn and come back to the exit. Big deal. I knew that already.
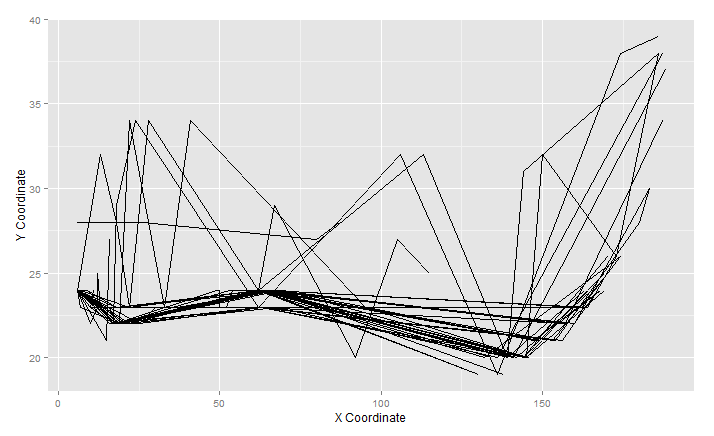
All of the truck moves plot on top of one another and the out and back operation generates a lot of parallel lines that are probably movements in opposite directions. I can’t tell which ones are coming or going, or where they are going. We might be able to do something useful with colored lines, but it still won’t tell much. So what to do? I know there’s a lot of detail in the data set. The video and Dartfish have done their job. Now I need a visualization method to pull out the information in a form that I can study and learn from. I turn to an old friend, the time-space diagram (also variously called the distance-time diagram and the space time diagram). It is almost universally used in traffic engineering, railroading, and theoretical physics to describe the flow of objects over space and time. Strangely, I have seldom seen it used anywhere else. Perhaps this is another opportunity.
The space time diagram is a great way to look at the behavior of moving objects. You can put many objects on the same 2D graph, yet see a lot of detail about their individual activities. The left panel below shows how you can construct the flow path. Just note where the object is along the distance axis at each point in time. Connect the dots and you have a flow or movement path. The panel on the right shows how, as long as the objects travel at different times, the flow paths will be distinct from one another. This puts a huge amount of information on a single visualization. You can represent the entire movement history over an extended period of time.
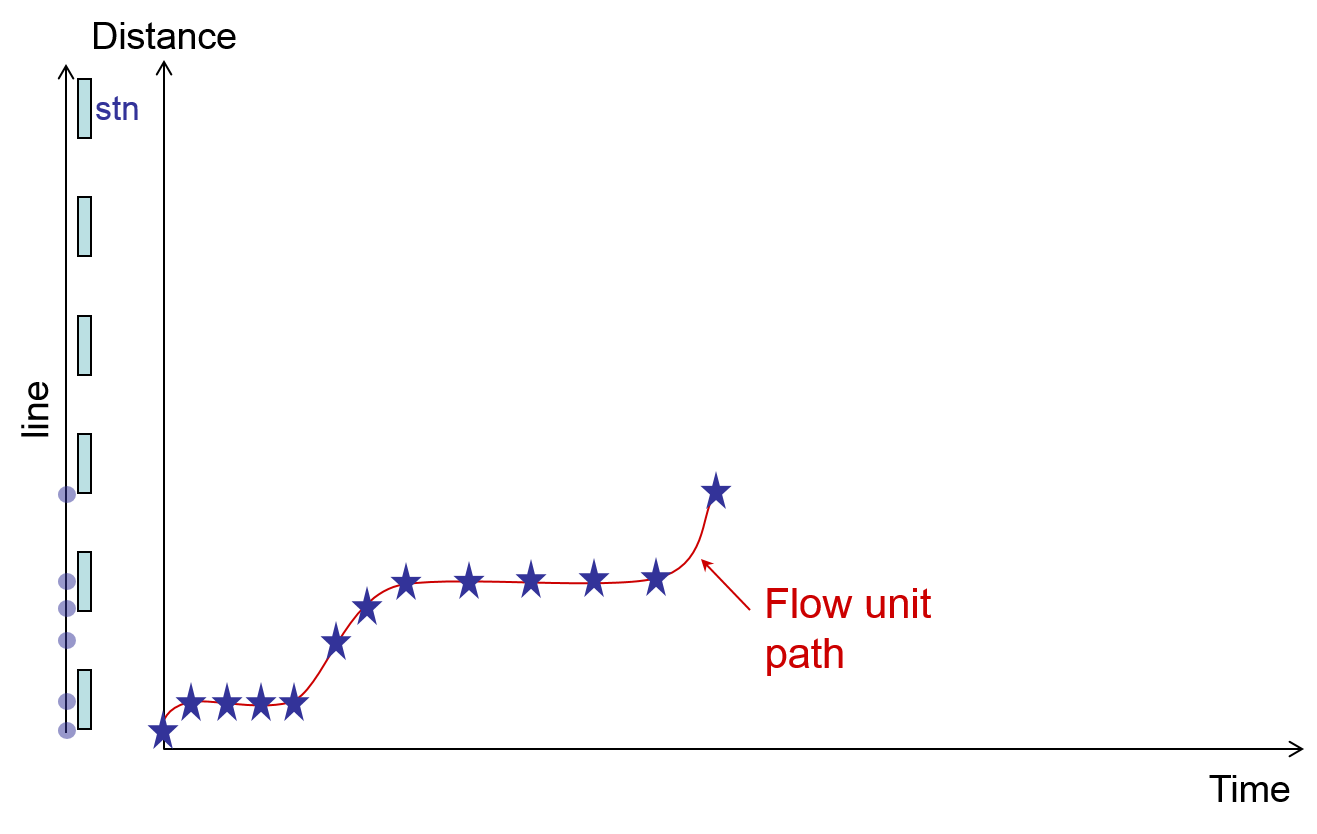 |  |
| You can plot the paths of multiple vehicles as long as they traveled at slightly different times. |
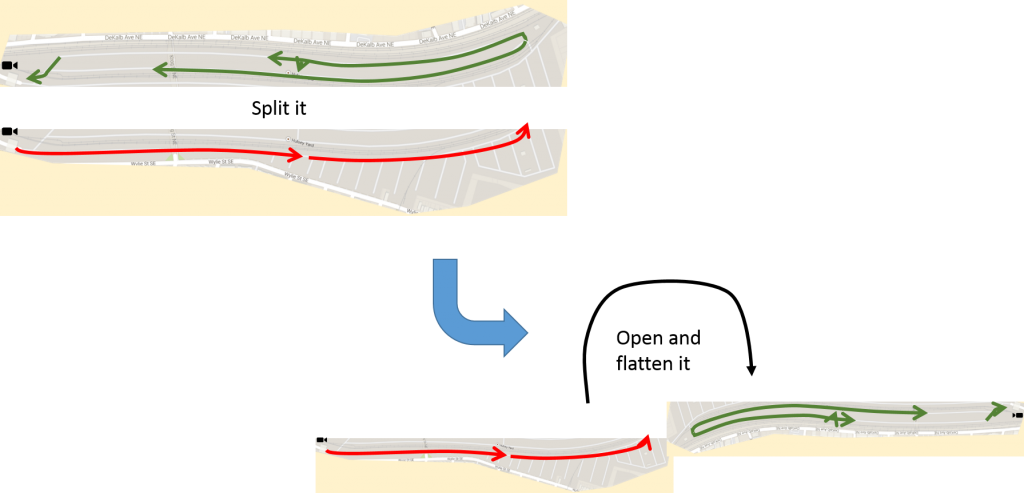
So how do we make a space-time graph for the Hulsey Yard. The first step is to recognize that there is a predictable progression for trucks that drop off or pick up containers. The trucks go down one side of the yard and come back on the other side. It looks like a 2D problem, but it is really mostly one dimension … just wrapped on itself. So the first step is to cut the layout in half and open it up into more or less a straight line.
Now I have a single dimension (more or less) that can be characterized as “distance”. I just have to convert the x, y coordinate data into that measure. I wrote a short script in R (statistical modeling language) that applies the Pythagorean Theorem to calculate the approximate distance between each point that I recorded on each truck’s journey. The script had to do some gymnastics to account for the fact that a positive x movement is progress on the bottom and reverse on top. However, it wasn’t too bad. The total script section for that was about 15 lines of code.
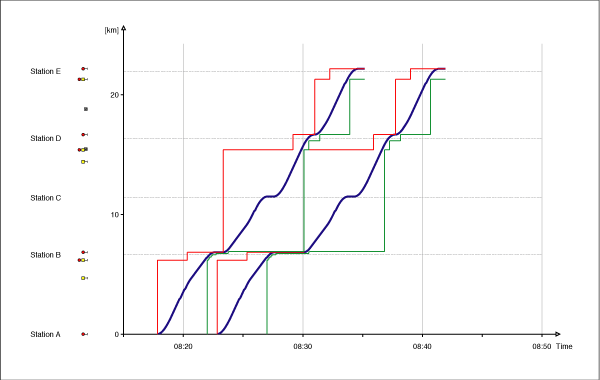
This gave me a “distance” between each recorded truck location. I just had to add those up to get a cumulative distance versus time … individualized for each vehicle. With that, I plotted the following crude version of a space-time diagram for the trucks in the Hulsey Yard.
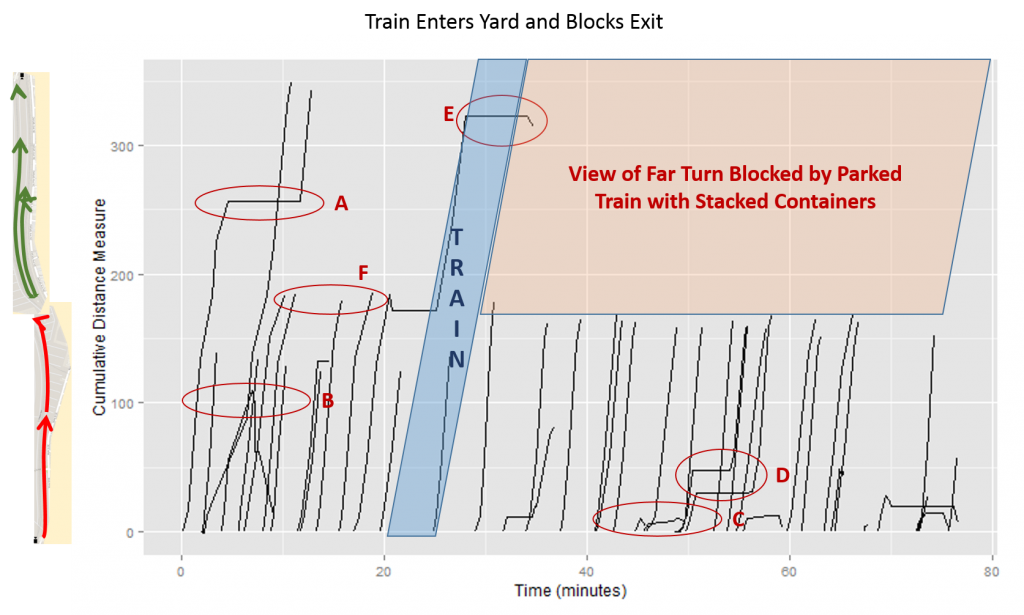
The almost vertical black lines show the journeys of individual trucks. Most of them move pretty smoothly and predictably around the circuit. Their paths resemble steeply sloped hash fill. There are, however, quite a few oddities and anomalies. The biggest event was the arrival of a string of new container rail cars that were stacked 2 high. As the string was arriving it blocked the exit from the yard. Once it was in place, the double height containers effectively blocked the camera’s view of anything that was happening at the far end of the yard. I could only tag movements up to the point that the trucks went out of view behind the train. Nonetheless, the diagram has some interesting tidbits to ponder:
- This truck spent a long time either waiting or parking. That occurred on the far side of the circuit, where a few trucks drove right up beside the container hoists and waited while their container was shifted directly onto the train. If I cared to, I could go back to the tagged video to see what actually happened.
- Something weird happened with this truck. Either the data got messed up or it violated the traffic flow protocol and tried to sneak back out on the aisle where it came in. Again, I can go back and check.
- This truck parked nearly at the entry gate, so it did go back out without doing the circuit.
- Three trucks entered the yard almost at the same time and two of them were assigned to park close to one another in the first parking area. The parking of the earlier truck blocked the later truck, extending the time it took for the second truck to drop its container and head to the exit.
- This truck was almost out of the yard when it got in a line waiting for the incoming train string of cars to pass by.
- These trucks all dropped their containers in the second major parking area that was just out of the camera’s vision. So I couldn’t follow them any further.
Due to the sight line limitation of the single camera, this diagram is not nearly as dense and information-rich as it could be. If I could have done the tagging from the array of surveillance cameras that I am certain are already in place, I could have pinpointed locations and actions for every truck (and eventually every other vehicle) in the yard over any arbitrary time period. It is a bit tedious, but not nearly as bad as most people might think.
This type of visualization can be developed for any process where locations are recorded for discrete objects as they travel from a starting point to an ending point over time. It could be any of the following:
- Progress along an assembly line
- Progress of shipments from an overseas supplier
- Progress of customers through a designed aisle sequence (likes some supermarkets)
- Progress of packages in a warehouse.
It’s not absolutely necessary to know a physical distance. Why not build a virtual distance measure for orders and payments flowing through an ERP system … or progress towards completion of a repetitive task. You wouldn’t need Dartfish. Just use milestones for the vertical scale.